
Part 5 of the Pi Edge Series. New to the series? Start with
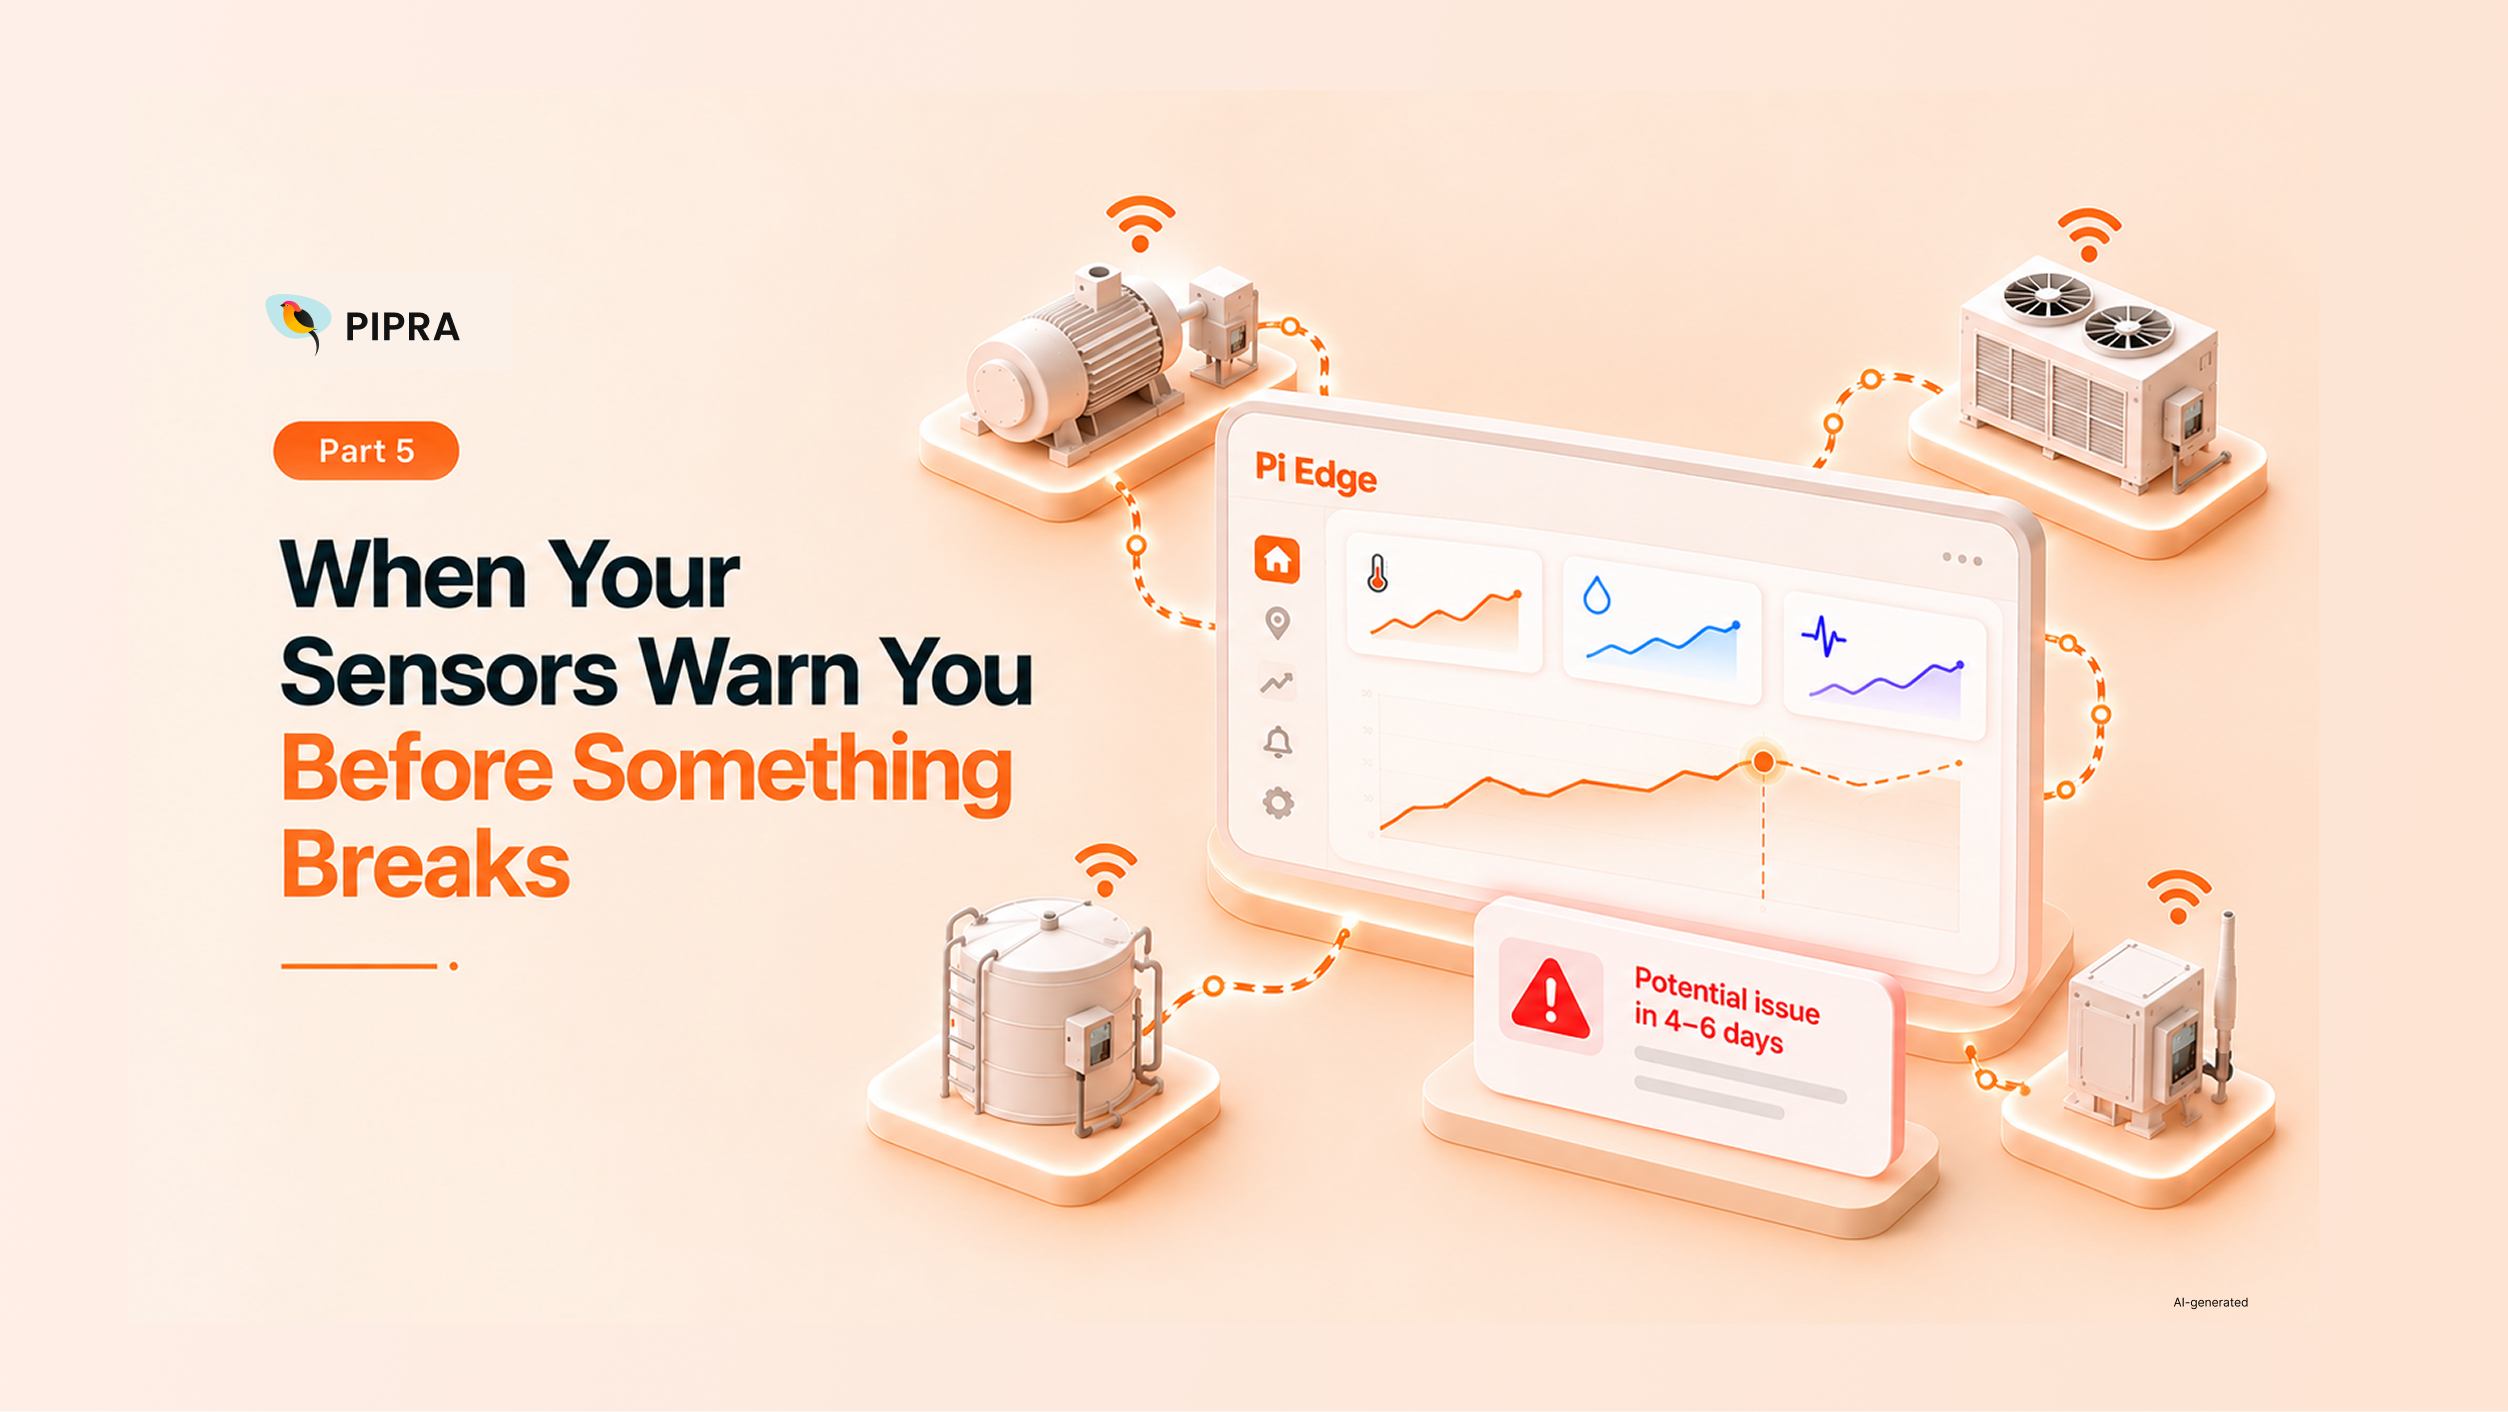
Pi Edge is PIPRA's IoT and edge intelligence platform it connects your sensors and site data, lets you monitor everything from one place, and alerts you before small issues become costly problems, scaling from one site to many at your own pace. This post covers the last step in that journey: how raw readings become trends, alerts, and early warnings, turning your sensor data into something that changes what you do, not just something you look at. The benefit: earlier issue detection and better decisions, with less manual effort problems caught while they're still small, instead of becoming unplanned downtime.
Here's an uncomfortable question about any monitoring system: what does it actually change?
A lot of them change nothing. Readings are collected, stored, and displayed on a screen that looks impressive in a demonstration and gets opened roughly once a month. When something goes wrong, the data is all there and the investigation afterwards confirms, in detail, exactly what everyone already knew had happened.
That's not monitoring. That's record-keeping with charts.
The difference between the two is timing. Record-keeping tells you what happened. Monitoring tells you what's happening, early enough to change the ending. This post is about the second one.
Start with the simplest problem: knowing what's going on right now.
In most operations this is genuinely difficult not because the information doesn't exist, but because it's scattered. One site's conditions are in one place, another site's in another, and nobody has a view across all of them without asking people and assembling it by hand. By the time the picture is complete, it's a few hours old and somebody's morning is gone.
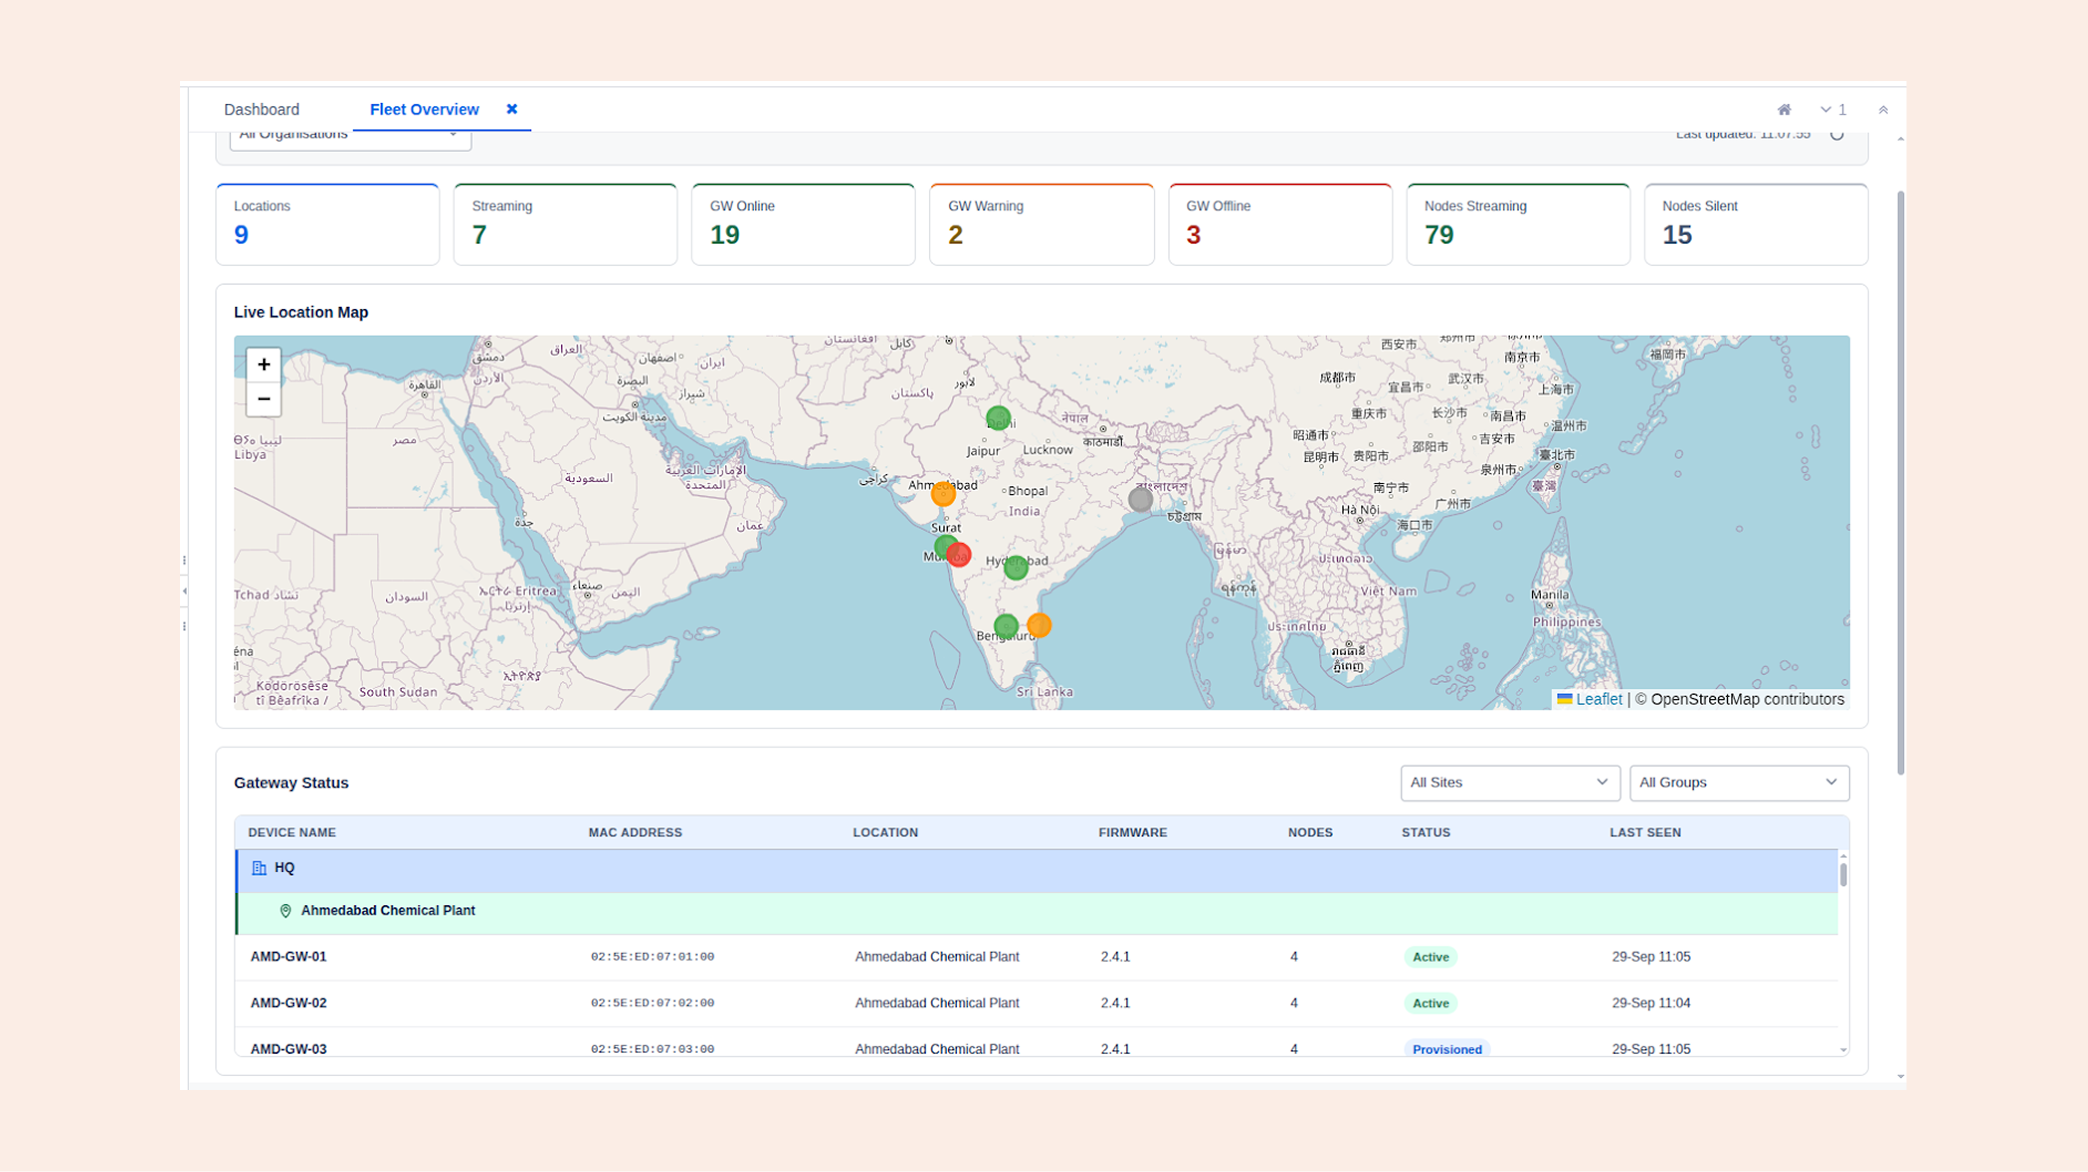
Fleet Overview puts the whole operation on one screen, live. Every site, every device, current conditions, updating as readings arrive rather than when someone refreshes. You open it and you know no assembly required, no phone calls, no waiting for a report to run.
The real value shows up on ordinary days, not dramatic ones. Being able to glance at your entire operation in ten seconds changes how often people look, and looking often is what makes small things get noticed while they're still small.
A single reading is almost never useful on its own.
Knowing a machine is at sixty-two degrees tells you very little. Knowing it's been at sixty-two for a month tells you everything is fine. Knowing it was at fifty-one yesterday tells you to go and look at it right now.
Same number, three completely different meanings and the only thing separating them is history.
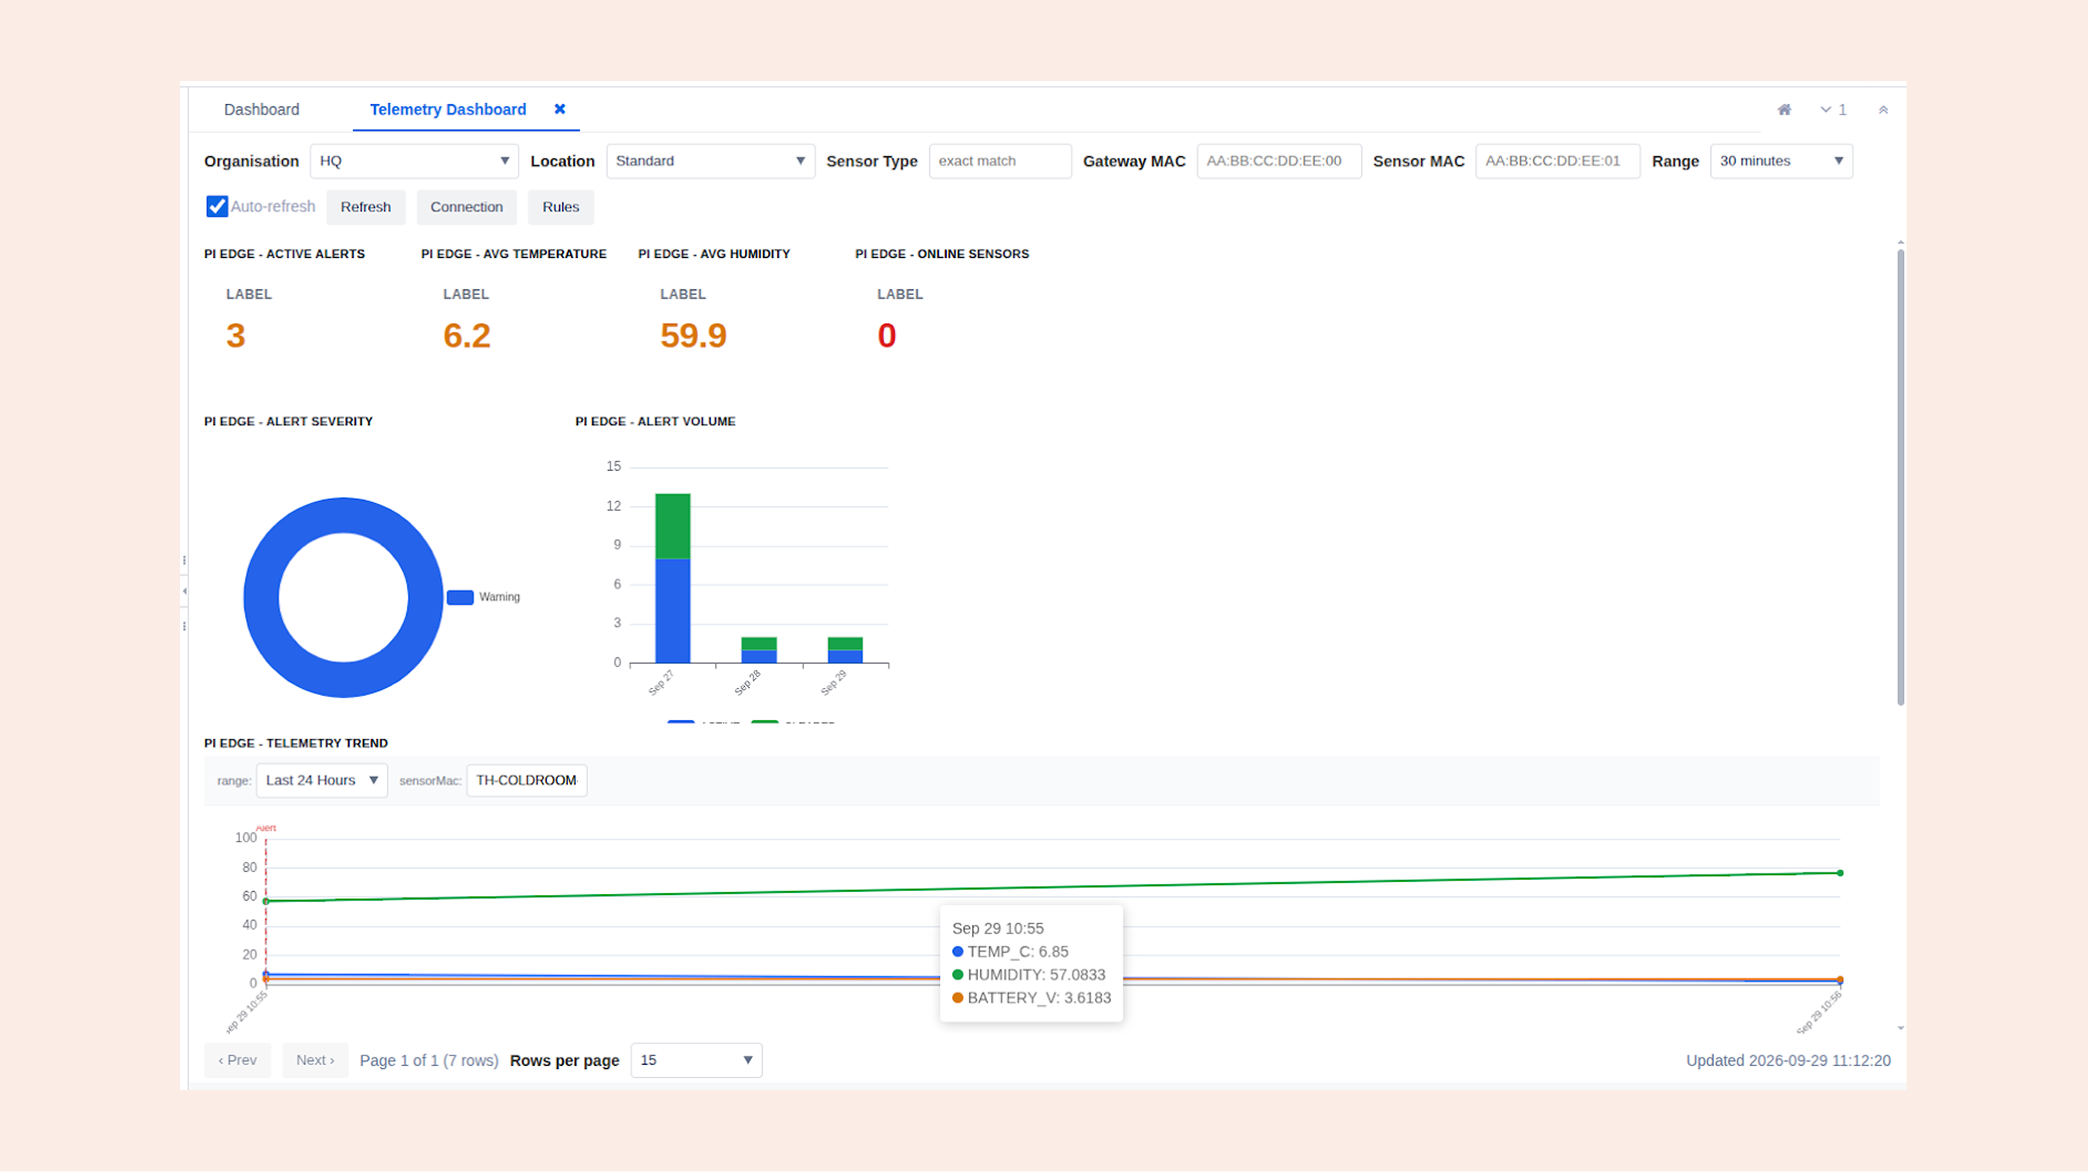
Telemetry Dashboard keeps that history and puts it directly next to the current value. Open any device and you see its readings over time: what's normal for it, what it's doing now, and whether that's a change. You don't need a specialist to interpret it. The shape of the line does the explaining.
This is what makes conversations about equipment concrete. "The machine seems hotter lately" becomes a chart showing a steady climb since a specific week and that's a conversation that leads somewhere.
Most alerting is a tripwire. Set a limit, and when a reading crosses it, someone gets told.
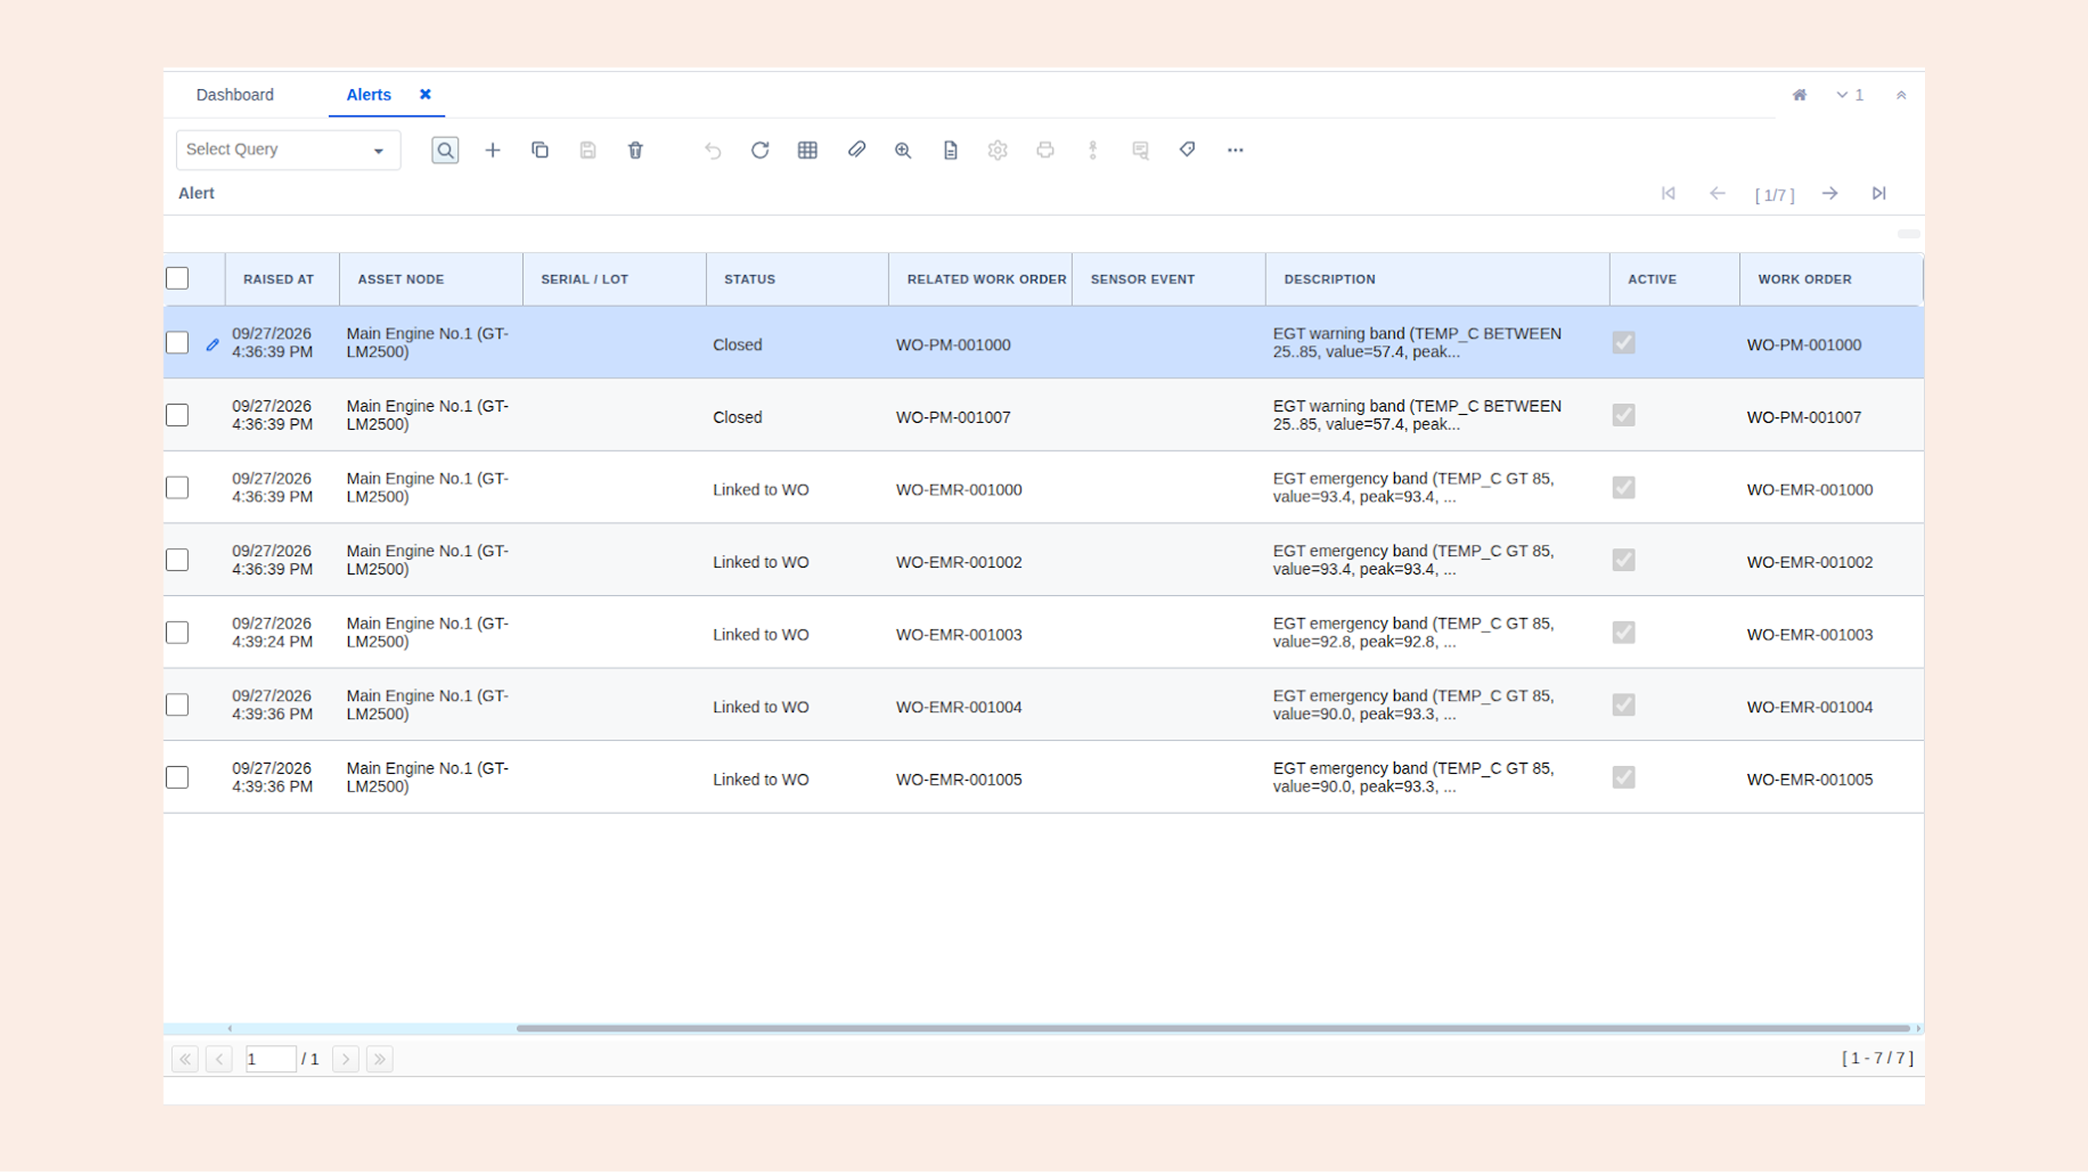
That's genuinely useful, and Alerts does it you set what's acceptable for a given measurement, and when something moves outside it you're told, without anyone watching a screen.
But a tripwire has an inherent limitation worth being honest about: it fires at the moment the problem becomes real. Not before. By the time a temperature limit is crossed, whatever the limit was protecting you from is already in progress. You've been informed, but you haven't been given time.
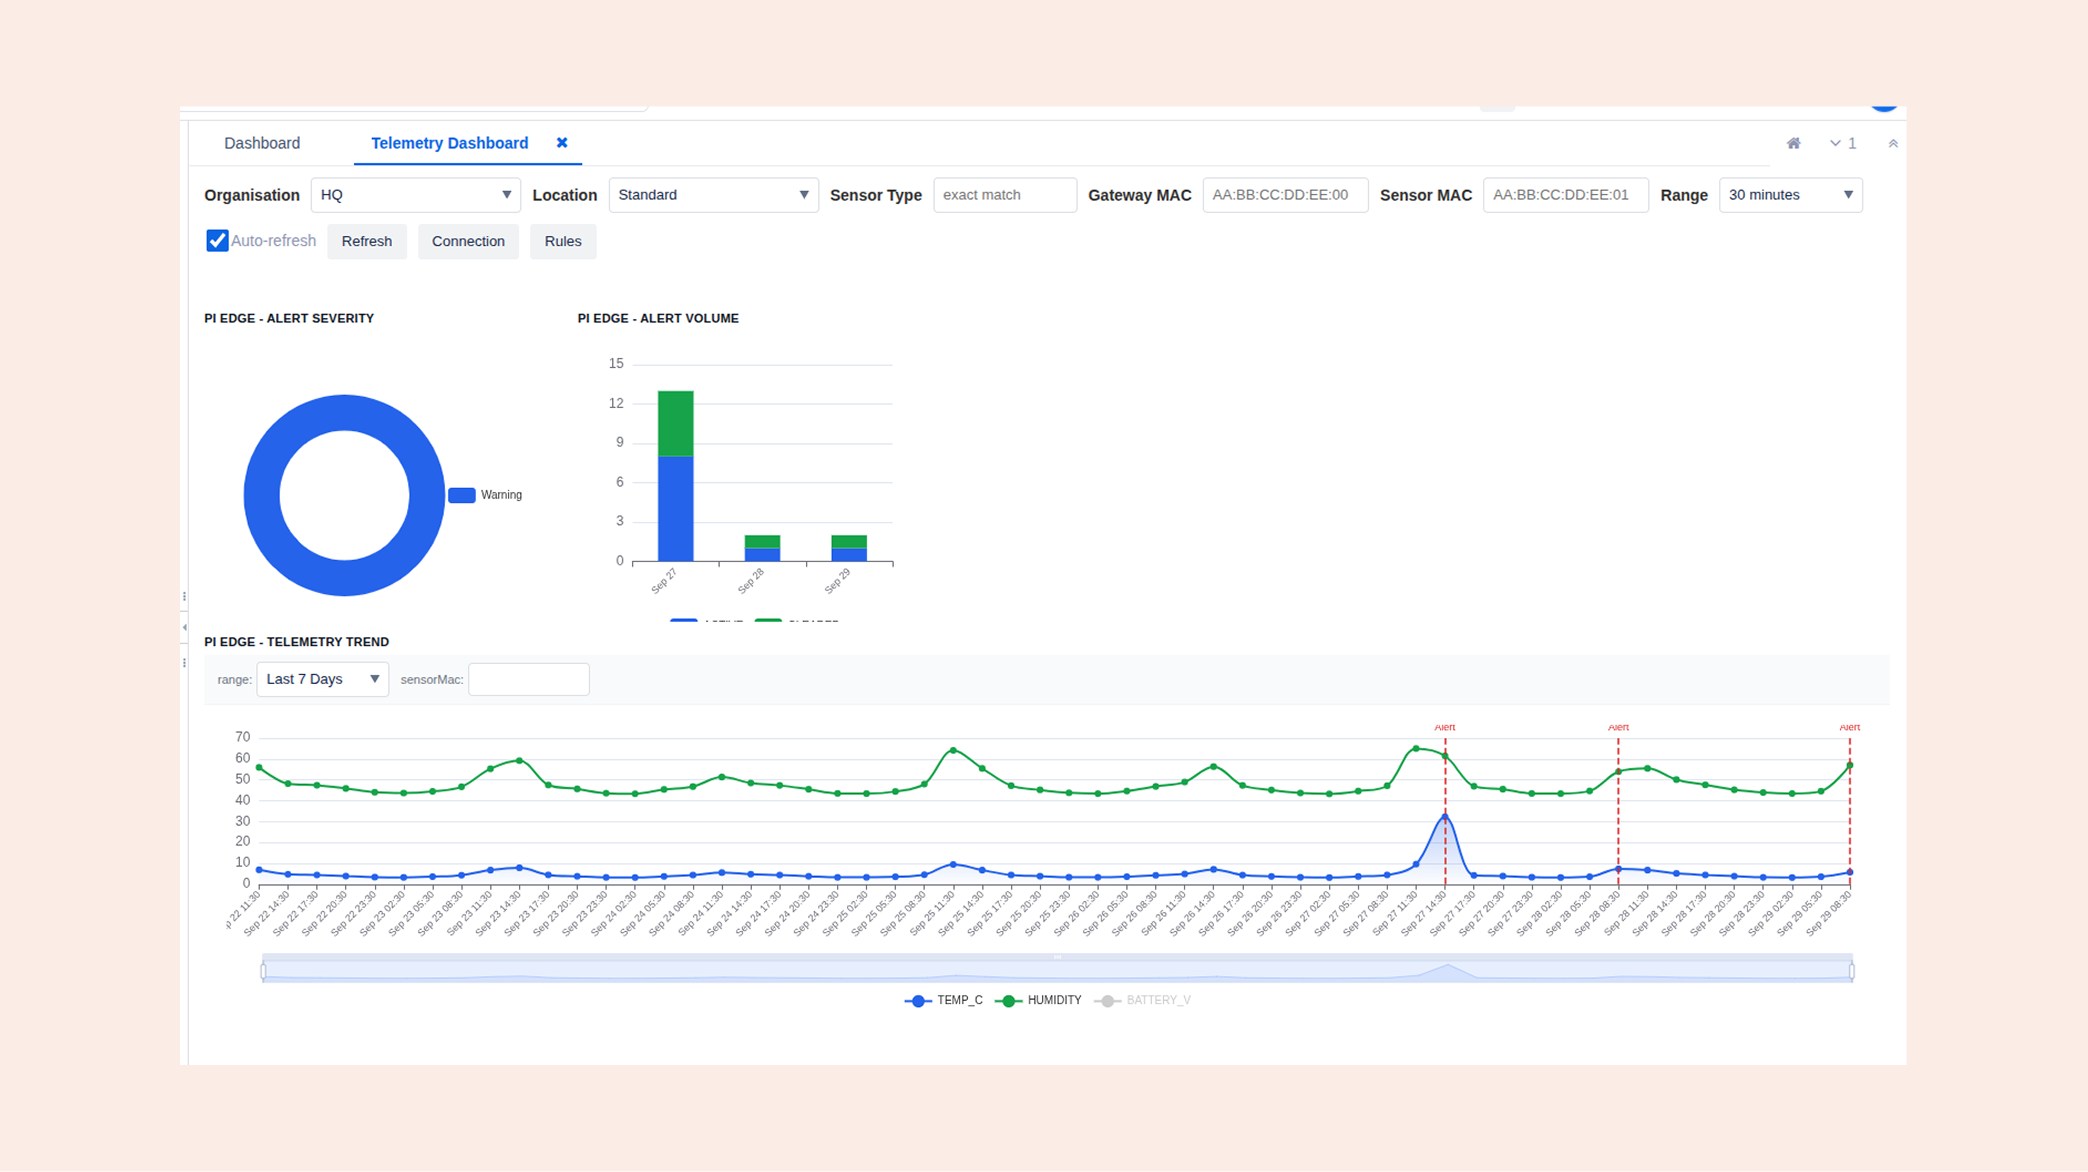
The more useful signal is direction. A reading that's still comfortably inside its limits but has been moving steadily toward them for two weeks is telling you something a tripwire cannot that you have a problem arriving on a schedule, and roughly how long you have to deal with it.
That's the difference between an alert that starts an emergency and one that starts a maintenance job.
Some situations are invisible to any single sensor, no matter how good it is or how well its limits are set.
Take a confined space with an oxygen reading and a gas reading. Each one, on its own, might look survivable neither has crossed its own line, so neither raises anything. Read together, at the same moment, they describe a hazard that either one alone would miss entirely.
Or take a machine where temperature has drifted up slightly and vibration has drifted up slightly. Both still within limits. Both individually unremarkable. Together, a bearing on its way out.
This is where monitoring gets genuinely interesting, and it's an area we're actively extending: looking at readings in combination rather than one measurement at a time, so the alerts you get reflect the situation rather than a single number. It's also where the value compounds because the more of your operation is connected, the more of these combinations exist to be noticed.
It's worth being straight about this phrase, because plenty of products use it loosely.
It does not mean a system that knows the future. Nothing does, and anyone claiming otherwise is selling something.
What it means, practically, is this: the readings that indicate a developing problem almost always exist well before the problem announces itself. A pump that fails on Friday was usually behaving differently by Tuesday. The information was there. It just wasn't being watched closely enough, consistently enough, across enough equipment, for anyone to notice in time.
That's the gap being closed. Not prophecy attention. Consistent, automatic attention on every measurement point in your operation, of a kind no human team could sustain manually, so that a Tuesday's worth of subtle change gets acted on as a Tuesday's maintenance job instead of a Friday's failure.
The failures you avoid this way are largely invisible. You don't get told about the breakdown that didn't happen. But the pattern shows up over a year in the numbers that do get noticed: less unplanned downtime, fewer emergencies, and maintenance that happens on a schedule you chose.
Analysis is only as good as what it's analysing, and this is where the earlier parts of this series pay off.
The readings arriving here are complete, because nothing was lost when a connection dropped. They're correctly understood, because the sensor was described properly at setup. They carry context which site, which zone, which piece of equipment because that context was attached the moment the device was first switched on.
Bolt an analytics tool onto a collection of separate systems and you spend most of your effort making the data trustworthy before you can learn anything from it. Here, that work already happened, in the four steps before this one.
If your current monitoring tells you what went wrong rather than what's going wrong, we'd be glad to show you the difference running, with real data, not a slide deck.