

PiEdge organises every deployment inside a structured hierarchy that mirrors how operations are actually run:
Organisation (Command / Division)
└── Location / Facility (Base, Dockyard, Vessel, Plant)
└── Zone (Deck, Bay, Section, Floor)
└── Device Group (Sensing Domain)
├── Gateway Devices (Edge Computing Nodes)
└── Sensor Nodes (IoT Measurement Points)
Because this structure exists before a single device is commissioned, operators never see a flat, unsorted device list. They filter by their own area of responsibility a plant manager sees their plant, a zone supervisor sees their zone — and multiple organisations, sites, and zones run side by side in one system.
When a gateway powers on at a site, it announces its presence to PiERP automatically. No one types in an IP address. No one pre-loads a configuration file. The device simply shows up in the Waiting Room a live queue of hardware ready to be commissioned.
The Waiting Room is built for scale, not one-at-a-time processing:
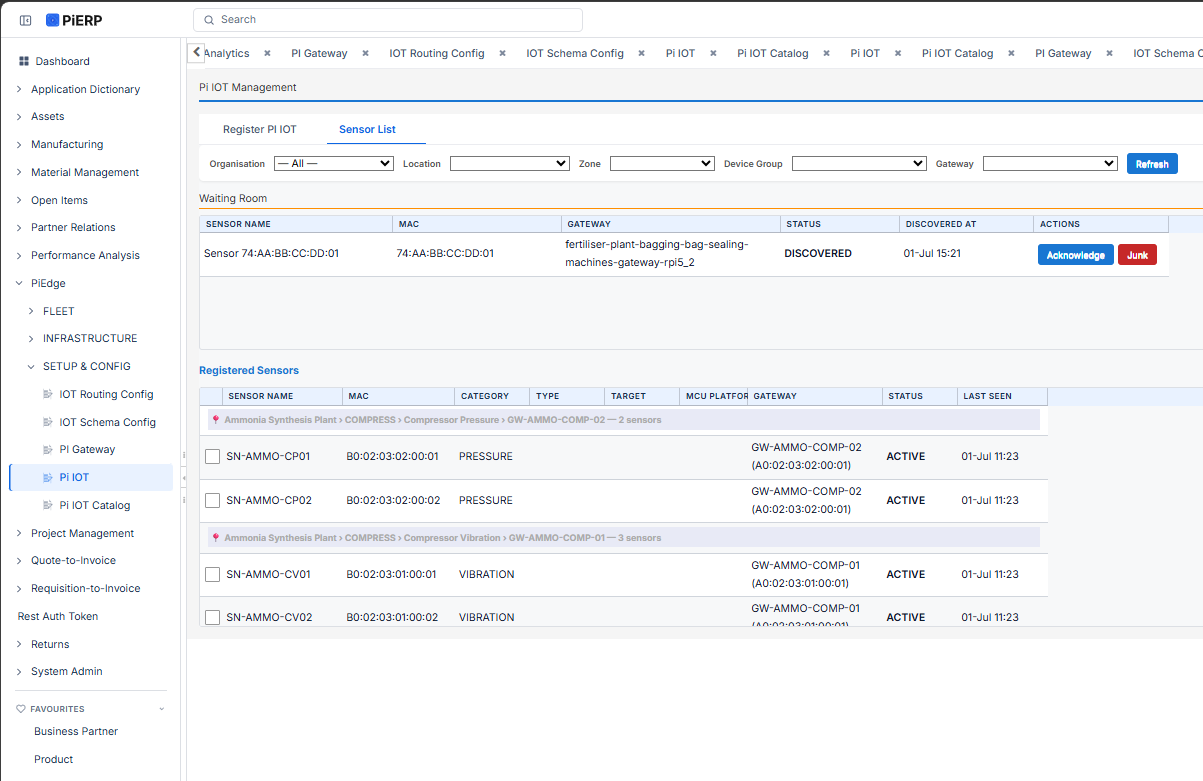
Sensor nodes get the same treatment. If a sensor begins transmitting data before it has been formally registered, PiEdge auto-discovers it from the telemetry stream itself and places it in the Waiting Room so a missed registration step never means lost readings.

Once a device is in the Waiting Room, an authorised operator commissions it in a short, guided flow:
From there, the device moves through a clearly visible lifecycle:
DISCOVERED → PROVISIONED → REGISTERED → ACTIVE ↔ OFFLINE
Once ACTIVE, it sends regular heartbeats. If a heartbeat goes missing beyond a configurable window 10 minutes by default — the device is automatically flagged OFFLINE. No one has to notice a silence; the system notices for them.
Sensor nodes follow their own registration path: the operator supplies the device's BLE broadcast name, links it to a parent gateway, sets a reading cadence, and selects the sensor category from a validated reference list.
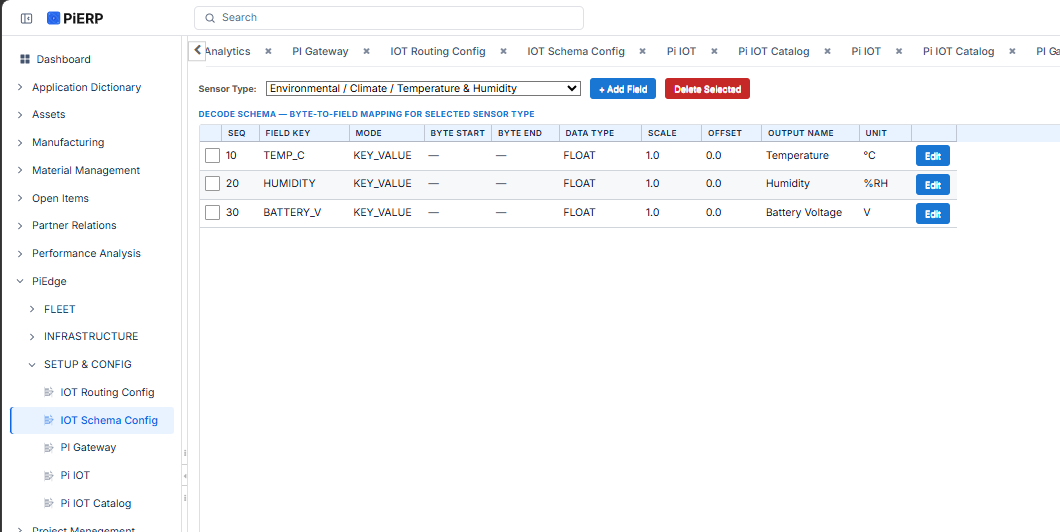
This is where PiEdge stops being a device tracker and becomes a genuinely open IoT platform. It ships with a built-in catalog of 37 sensor types across 7 sensing domains gas and air quality, climate and weather, water quality, mechanical and safety, electrical, occupancy and access, and safety and tracking each one defining its measurement target, sensing technology, MCU interface, and logic level.
But the catalog is a starting point, not a ceiling. New sensor categories can be added through reference data configuration so a facility with an unusual measurement need is never blocked waiting on a code release.
Every field a sensor reports is mapped to a decode schema entry that defines the field key, data type, scale factor, offset, output name, and unit. That single piece of configuration is what lets PiERP store, display, and threshold-evaluate a brand-new sensor type without a single line of custom code. Register the schema once; every device of that type just works.
Automatic backfill rounds out the picture: if a sensor starts transmitting before its category or node type has been manually set, PiEdge fills those fields in from the payload itself while never overwriting anything an operator has already configured.
Every sensor node publishes over MQTT using a structured, predictable topic pattern:
piedge/data/{gatewayMac}/{SensorCategory}/{SensorType}/{sensorMac}
That structure is what makes routing dynamic instead of hand-wired. A reading from any sensor, on any gateway, at any site, carries its own routing information in the topic itself — the gateway it came from, its sensing category, its type, and its unique identity. PiERP doesn't need a bespoke pipeline per device; the topic tells the system everything it needs to route the payload correctly.
The gateway forwards these readings to PiERP over the IoT Core pipeline, and PiEdge handles multiple data formats and timestamp precisions automatically detecting second- versus millisecond-precision payloads regardless of firmware variation, so time-series alignment stays accurate across a mixed fleet.
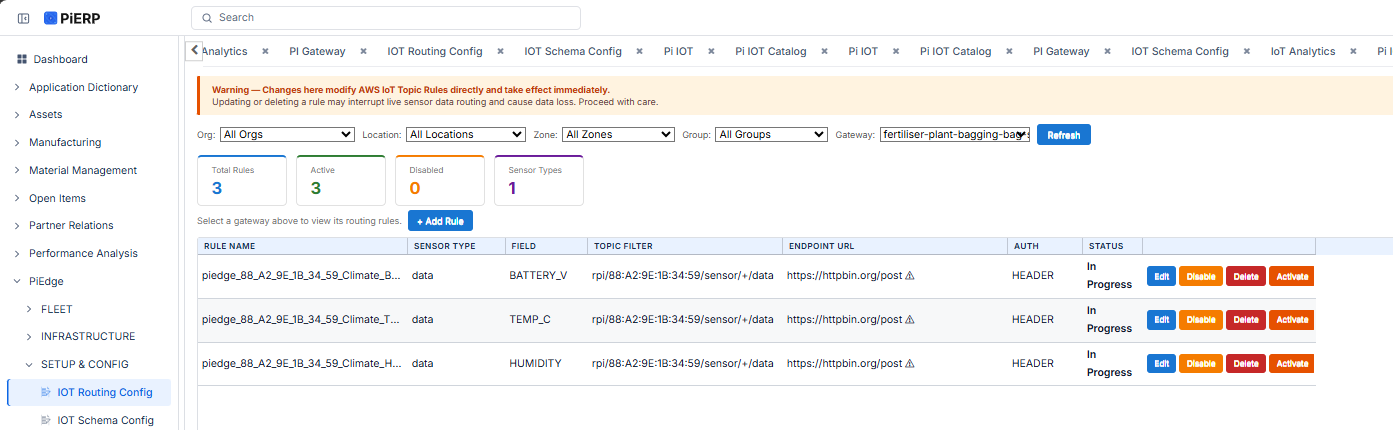
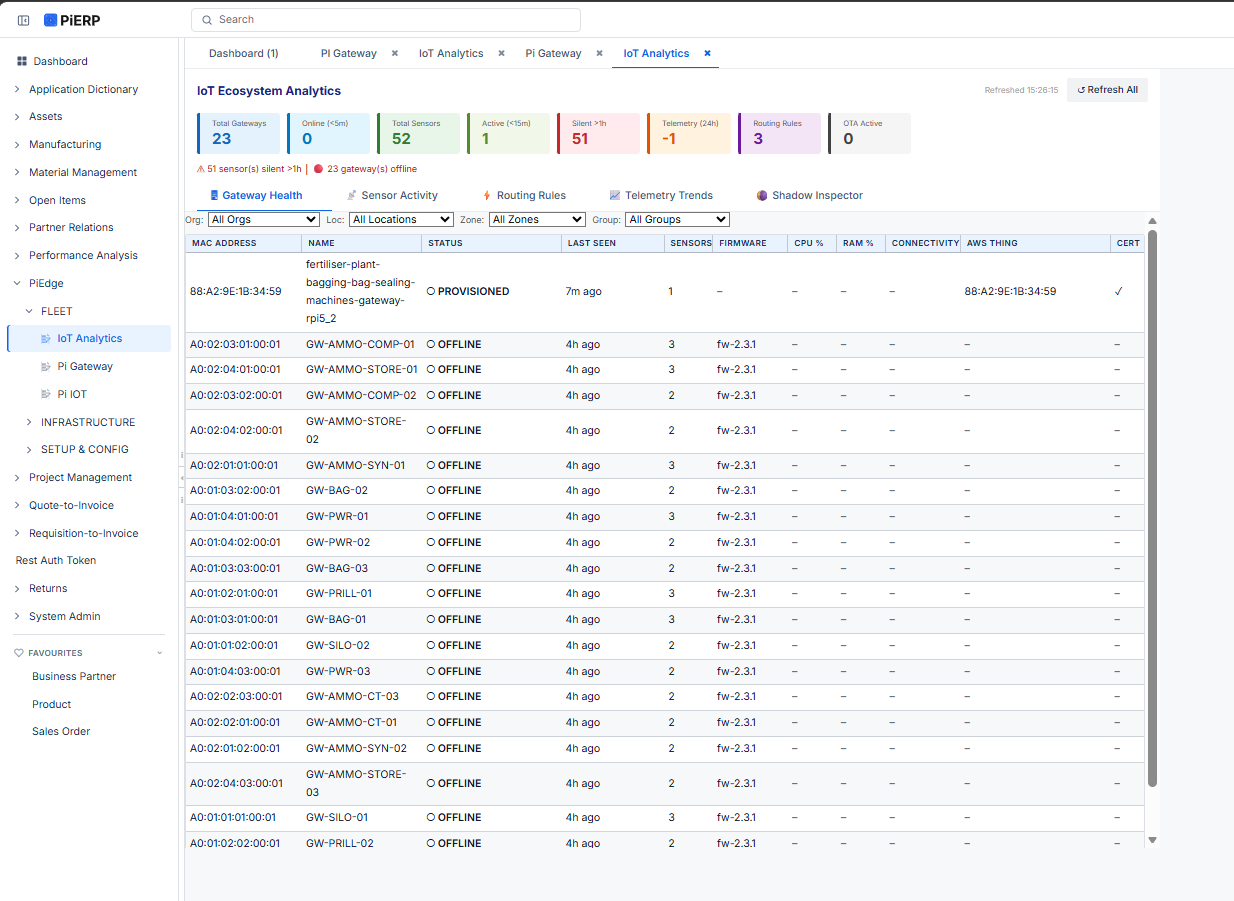
Two grouped, filterable views give operators full visibility once devices are active:
Status is colour-coded across the full device lifecycle ACTIVE, OFFLINE, PROVISIONED, OTA_PENDING, DEREGISTERED so an operator scanning a fleet of hundreds of devices can spot what needs attention at a glance.
Once a device is active, PiEdge keeps it manageable without anyone touching the hardware again:
For hazardous, confined, or remote locations, this means maintenance and configuration work that used to require a physical visit now happens from a desk.

Discovery and routing solve where the data comes from. What happens next is where the operational value shows up and that is where PiIoT Sync, PIPRA's telemetry analytics layer, takes over.
Every payload PiEdge routes flows through AWS IoT Core into PiIoT Sync's ingest pipeline, where it is authenticated, decoded against the device's registered schema, and written to a dedicated, per-field time-series table. From there:
This is the arc that matters to the enterprise: a device is discovered without manual setup, commissioned in minutes, routed automatically because its topic and schema already describe it, and from that point on, every reading it produces is feeding live dashboards and threshold-based predictive alerting with no separate integration project required to get there.

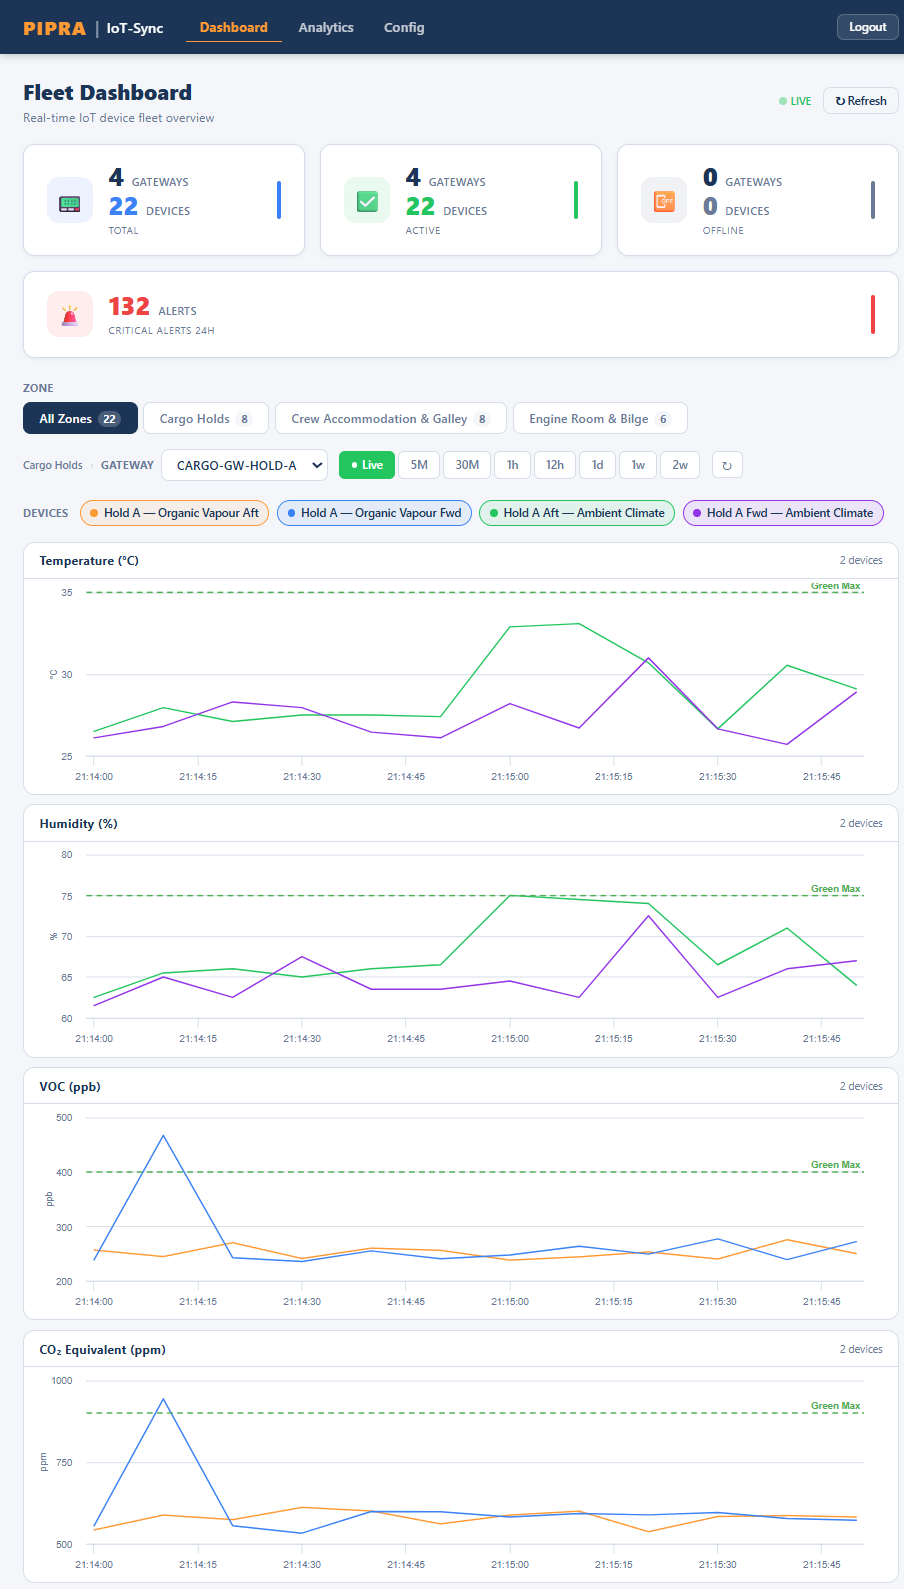
PiEdge is not a standalone monitoring tool bolted onto an ERP. Device groups, locations, and organisations are shared directly with PiERP's asset management, maintenance (MRO), and organisational hierarchy modules. A sensor threshold breach can trigger a maintenance work order in the same system that discovered the device in the first place no data leaving the platform, no second integration layer to maintain.
That is the practical benefit for an enterprise evaluating IoT platforms: the same system that finds a new gateway on the network is the system that turns its readings into a predictive maintenance alert three months later — without anyone writing new integration code in between.
PiEdge and PiIoT Sync are part of the PIPRA Solutions platform. If you want to see a walkthrough or discuss how automated discovery and predictive alerting map to your own fleet — industrial, naval, or facility-based — we would be glad to connect.Reach out to PIPRA Solutions to see what it looks like in practice.